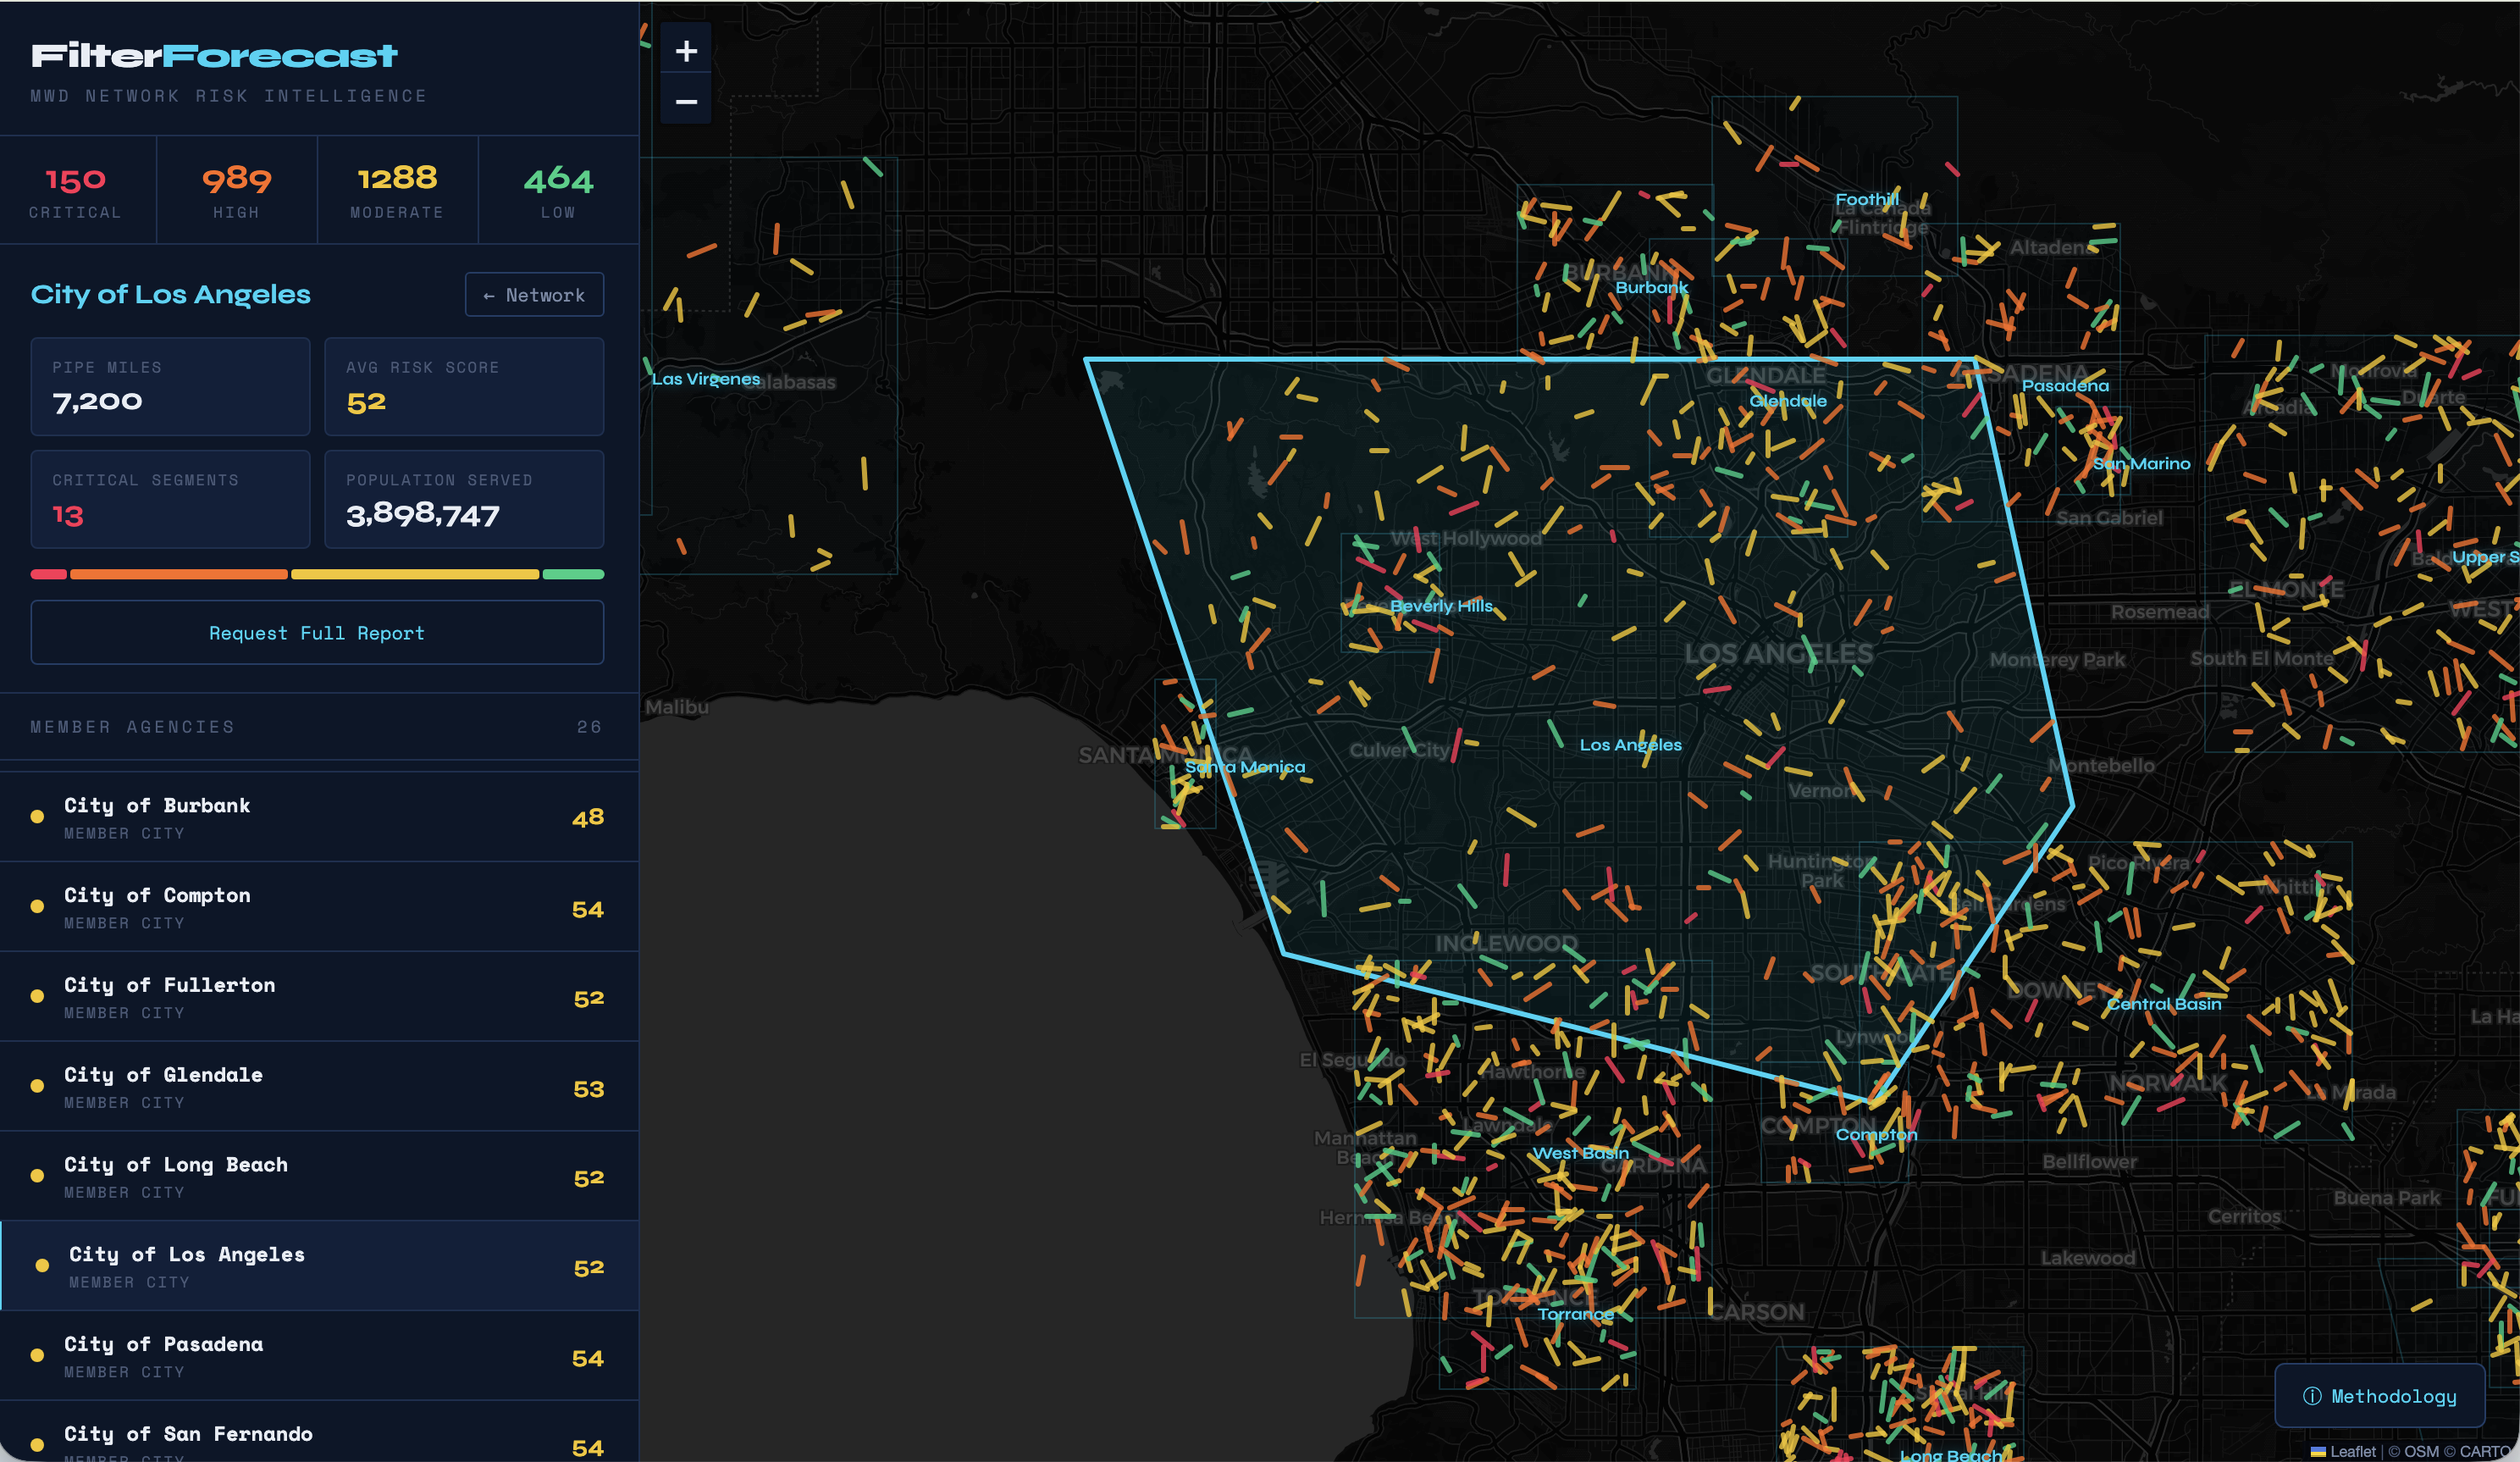
City of Los Angeles · 7,200 miles
The City of Los Angeles water network spans 7,200 pipe miles serving 3.9 million residents. FilterForecast scores risk across the full distribution network at the pipe-segment level.
FilterForecast · Available Now
FilterForecast is Applied Predictive Analytics’ (APA) live platform for predicting pipe-segment failure risk across water utility distribution networks.
How FilterForecast works
FilterForecast combines asset inventory, environmental context, and operational history into a continuously-updated segment-level risk score. Risk scores are visualized on an interactive map scoped to each utility’s territory, with drill-down to the city, district, and pipe-segment level. Patent pending.
A utility’s own inventory of distribution-network assets is the foundation of the risk picture.
Regional context drawn from primary-source surveys, including data published by the California Geological Survey (CGS).
Each utility’s own operational history sharpens the model over time.
At any scale
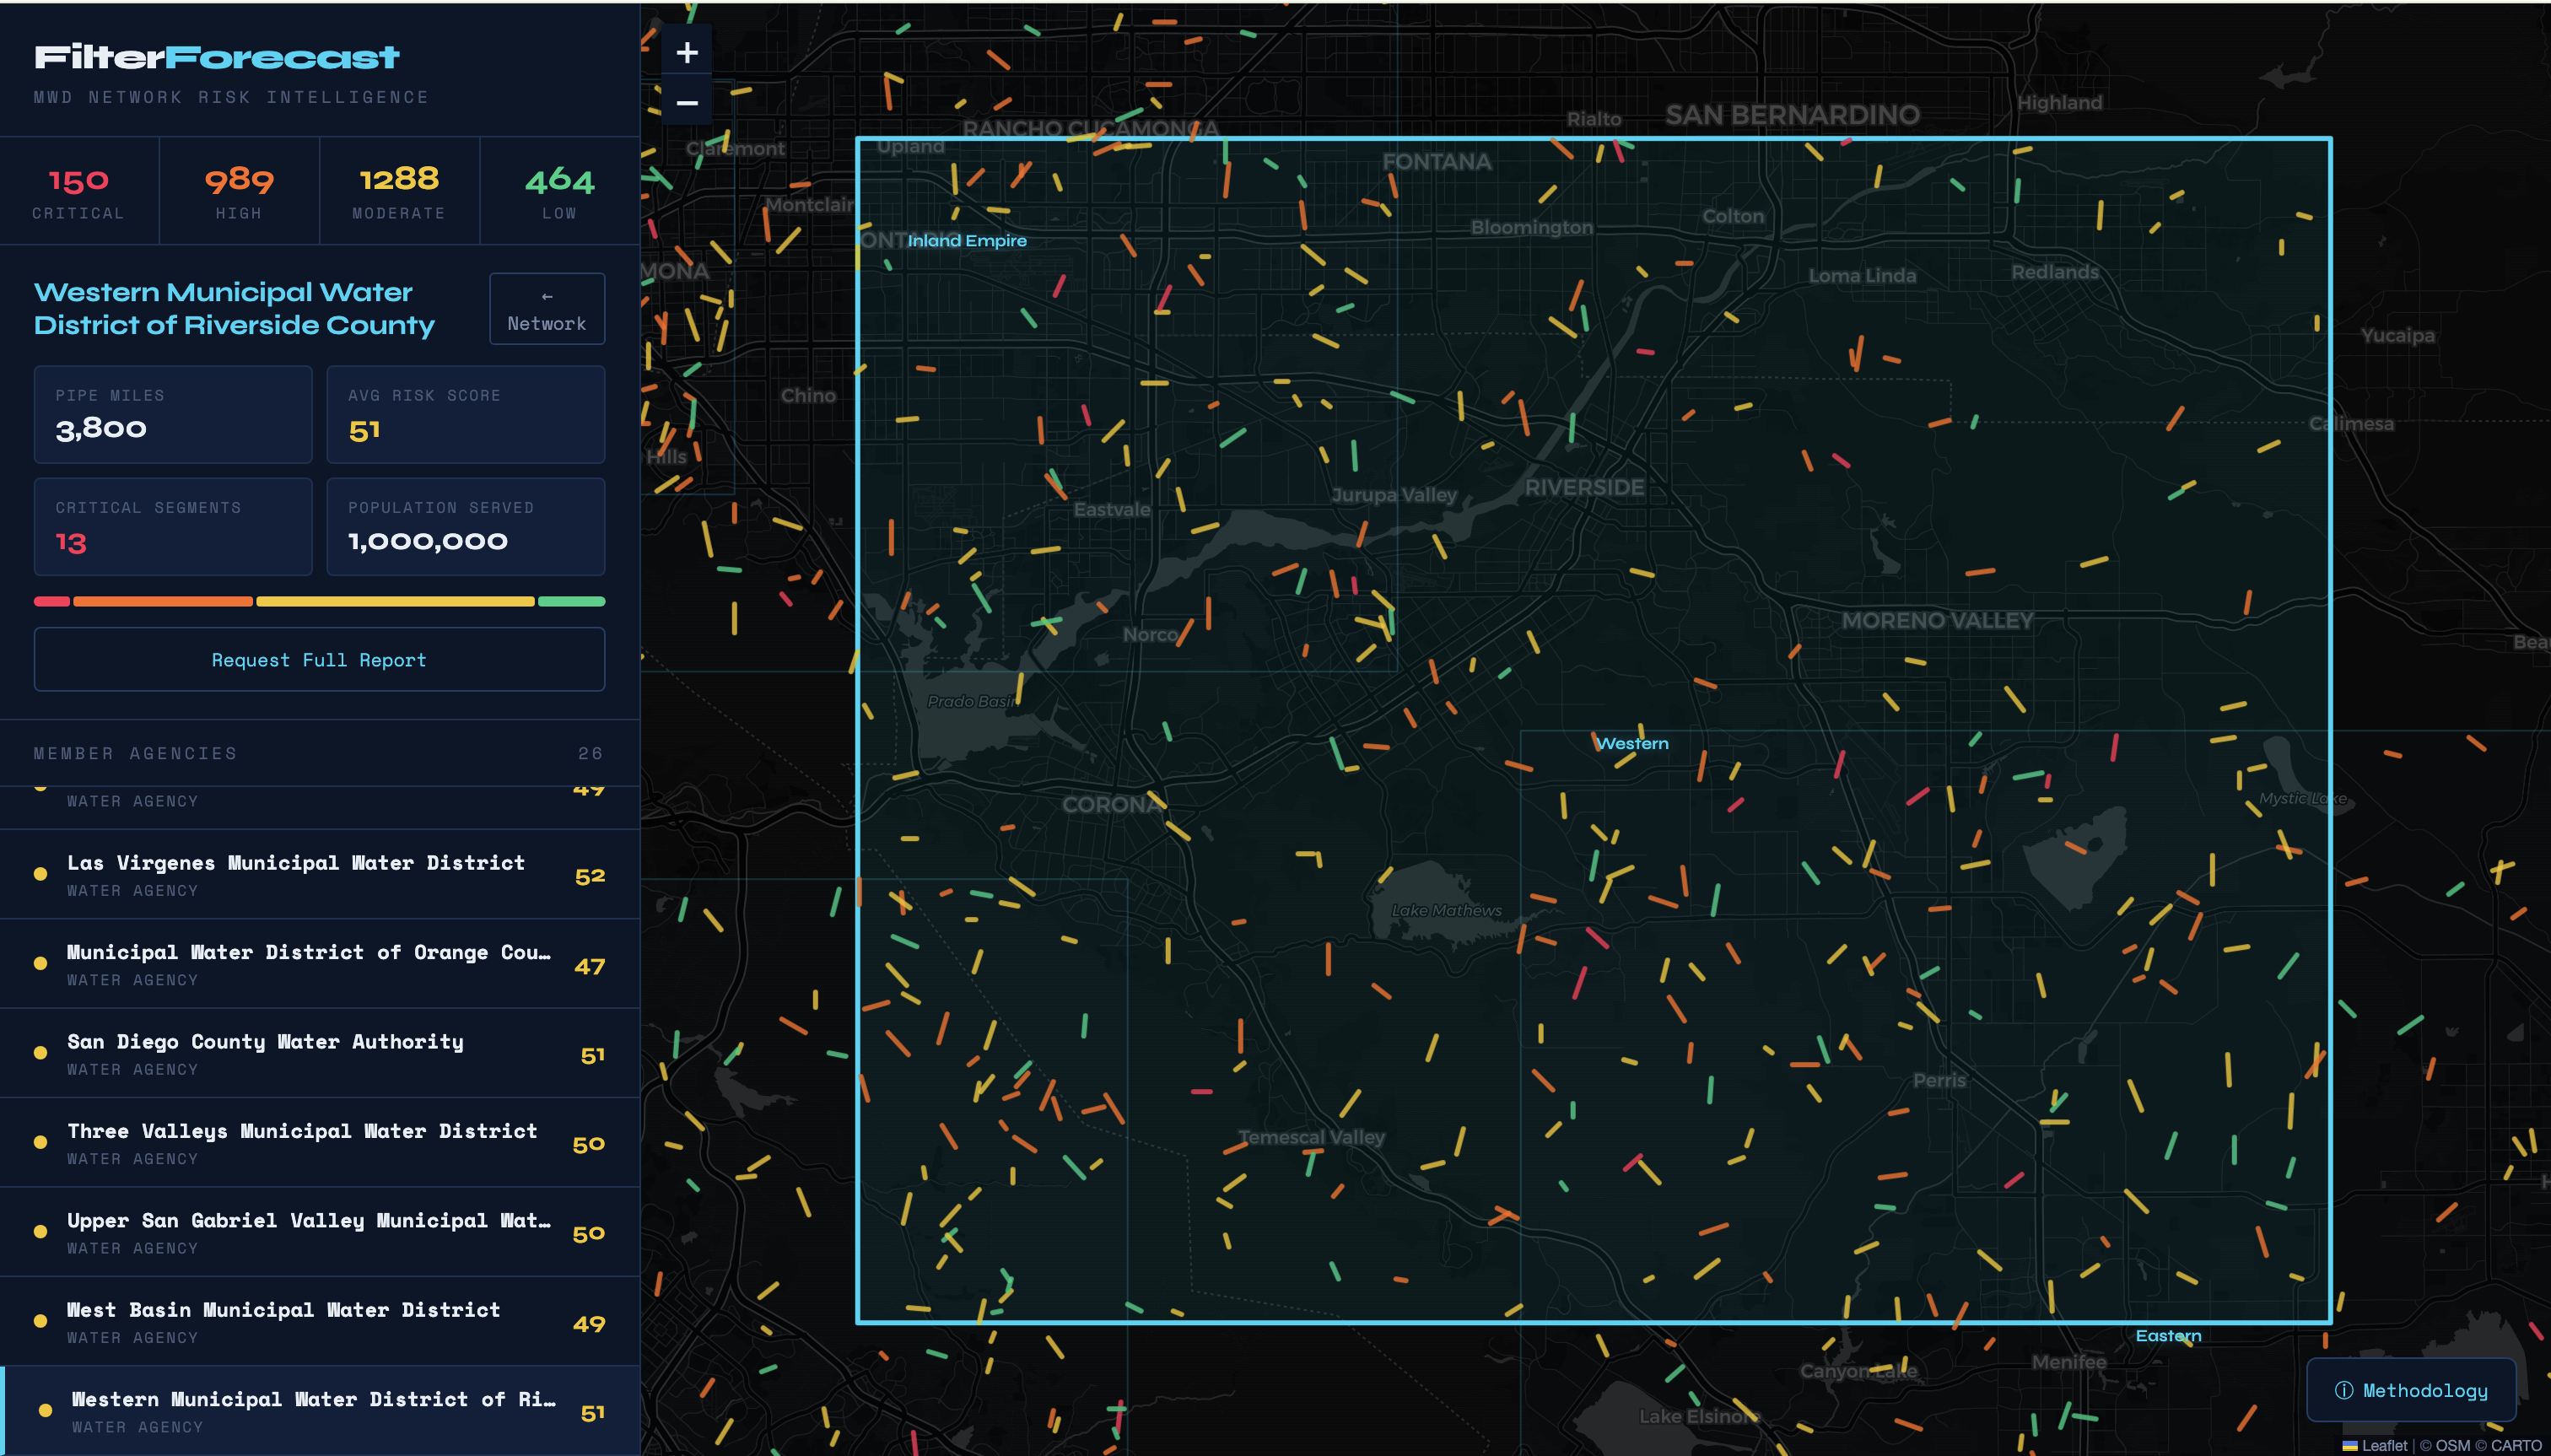
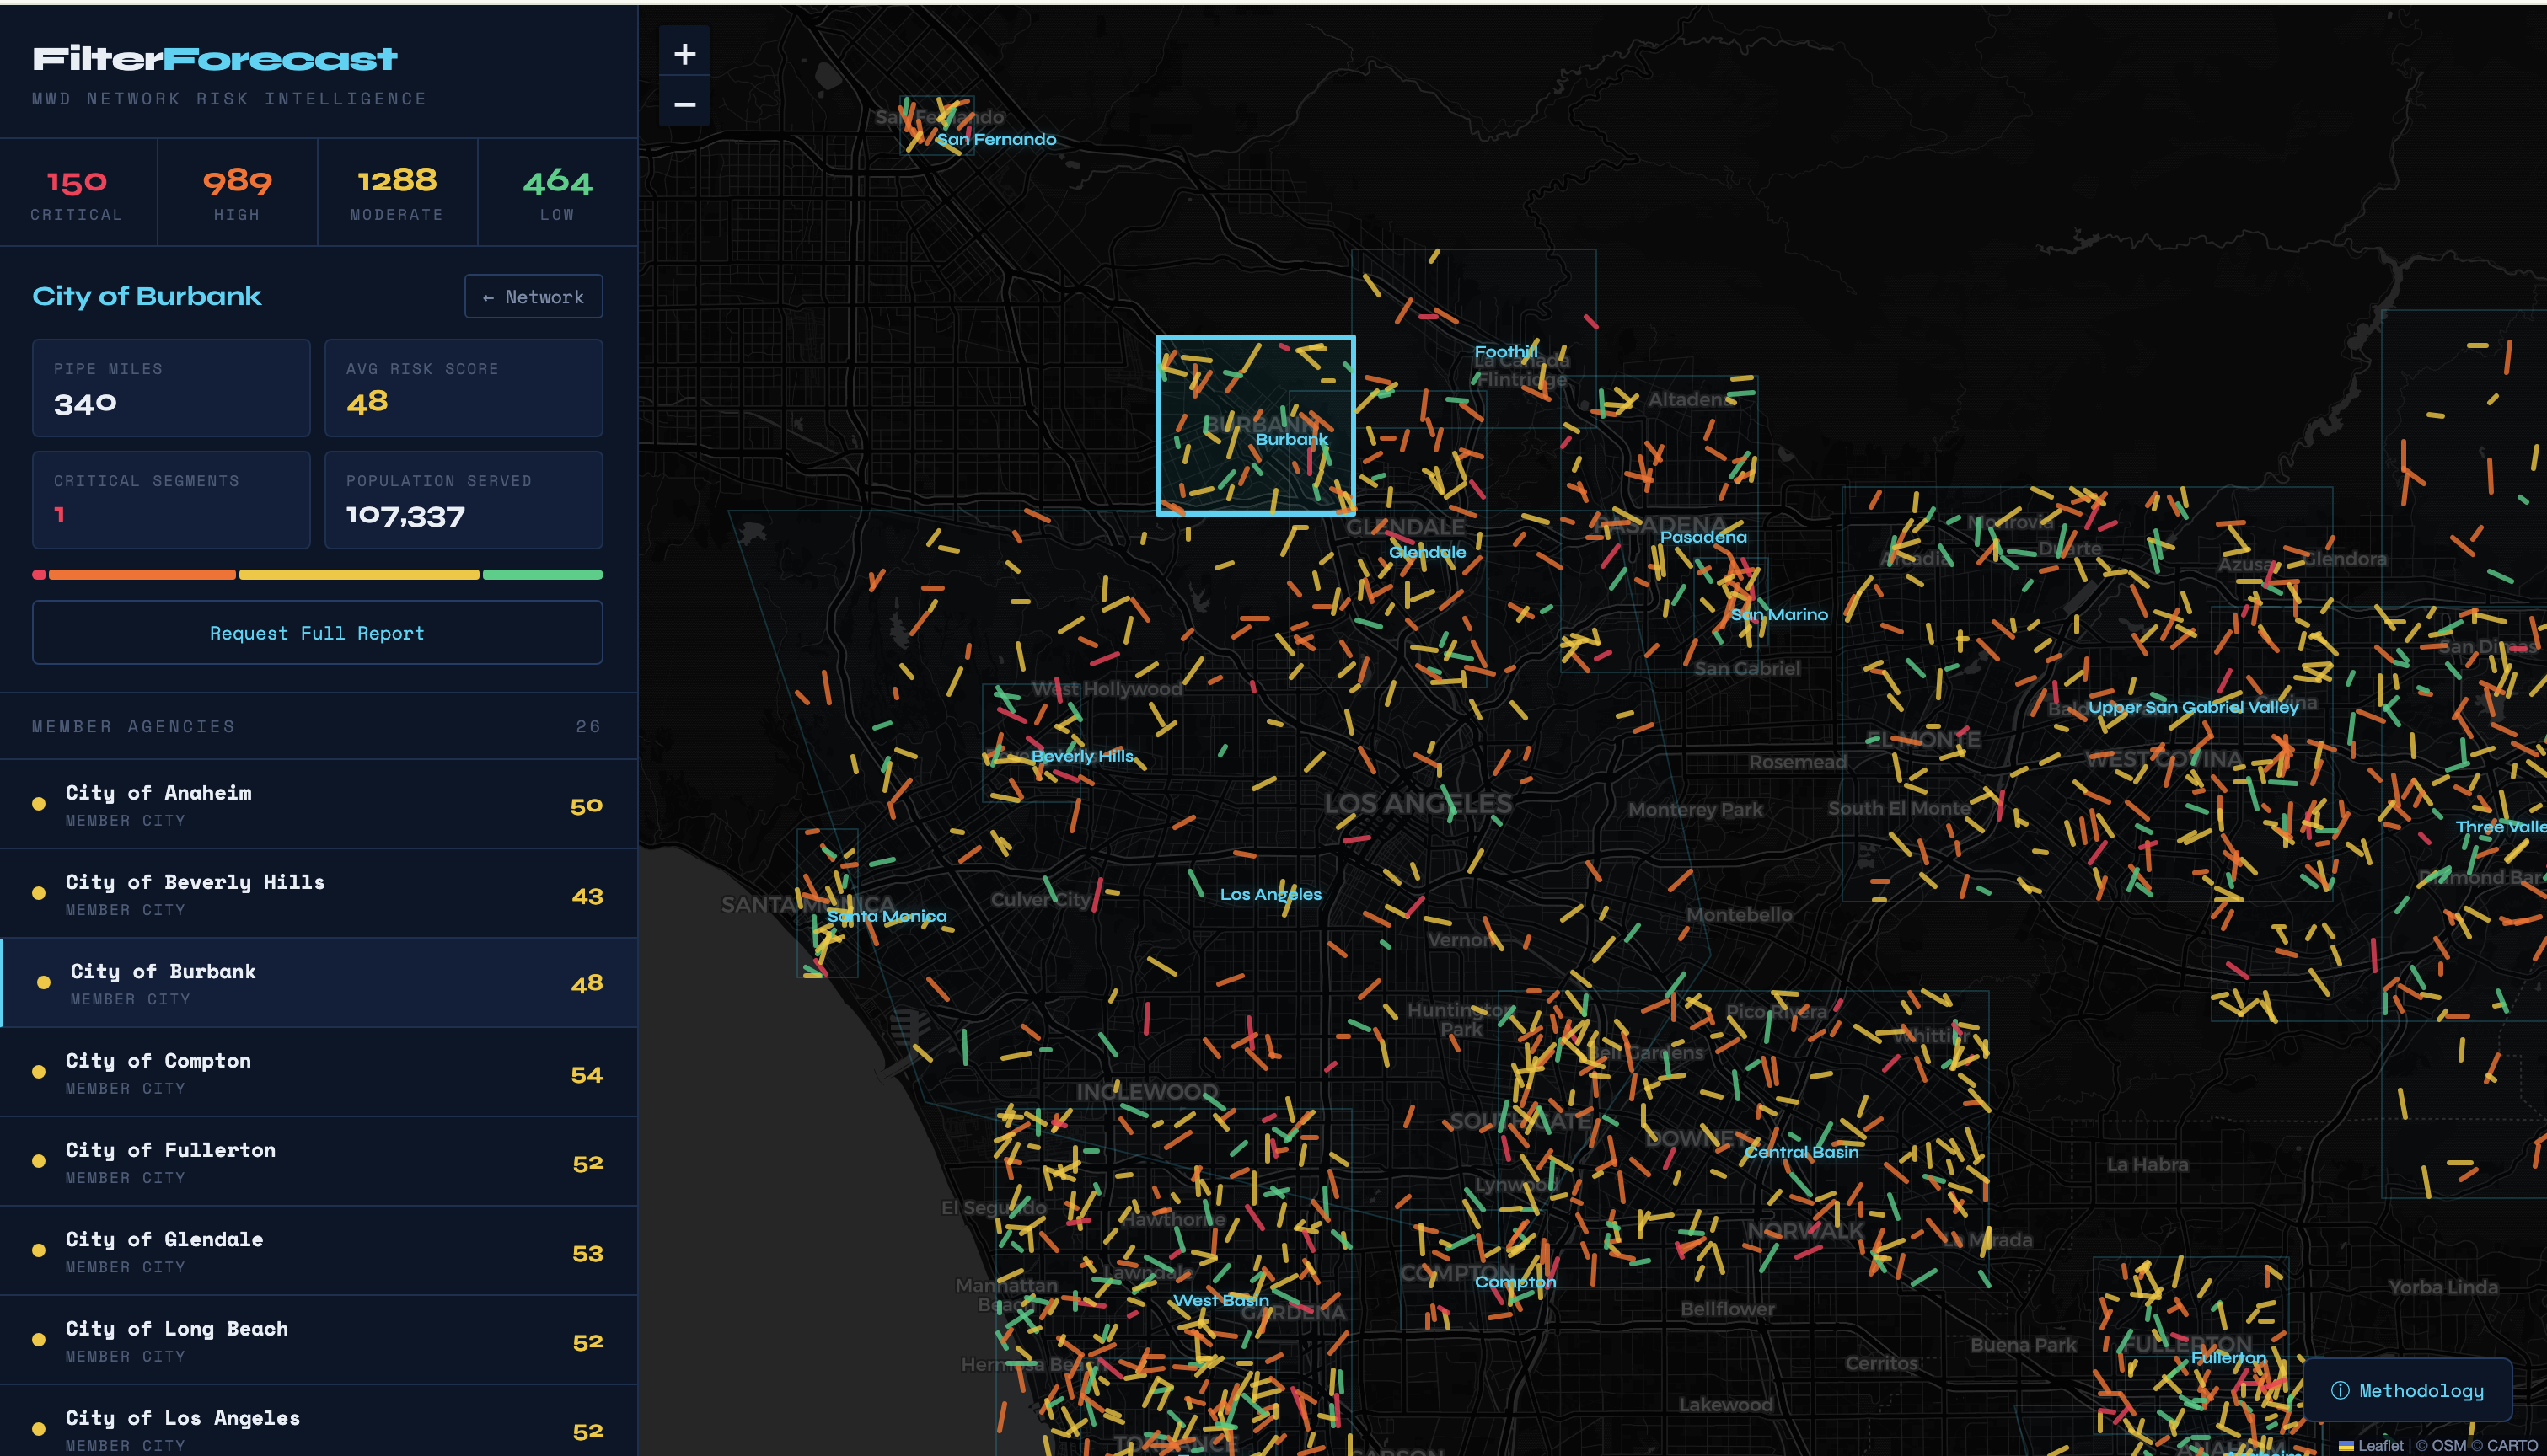
From a 340-mile city network to a 3,800-mile regional district, the same model surfaces the highest-risk segments.
The City of Los Angeles water network spans 7,200 pipe miles serving 3.9 million residents. FilterForecast scores risk across the full distribution network at the pipe-segment level.
Regional wholesalers like Western Municipal Water District cover multiple service areas across the Inland Empire. FilterForecast scales to the full 3,800-mile network and aggregates risk across downstream member agencies.
Smaller MWD member cities get dedicated drill-down views at the same level of detail as the regional view. Burbank’s 340-mile network serves 107,337 residents.
Integration
FilterForecast ingests GIS pipe-network data and CMMS maintenance records, and can consume SCADA telemetry where available. Integration happens as part of APA’s phased engagement — assess, integrate, prevent. Standard connectors support common utility platforms; custom connectors are scoped per engagement.
FAQ
FilterForecast uses a multi-factor model combining asset inventory, environmental context, and operational history. The model is continuously improved as each utility’s own operational history is integrated. Patent pending.
Continuously. FilterForecast is not a quarterly report — risk scores refresh as new data flows in from GIS updates, CMMS activity, and SCADA telemetry (where connected). This is the core of the “Continuous monitoring, not quarterly snapshots” design principle.
FilterForecast currently covers Metropolitan Water District (MWD) member agencies across Southern California, including the City of Los Angeles, City of Burbank, Western Municipal Water District of Riverside County, and other MWD member cities and water agencies. Expansion to additional MWD members and out-of-region utilities is active.
Most utilities begin with APA’s Infrastructure Risk Assessment — a 4–6 week scoped diagnostic that validates the model against the utility’s existing data and delivers a prioritized risk register plus implementation roadmap. Schedule at calendar.notion.so/meet/apa-it/systems-assessment.