
Available Now
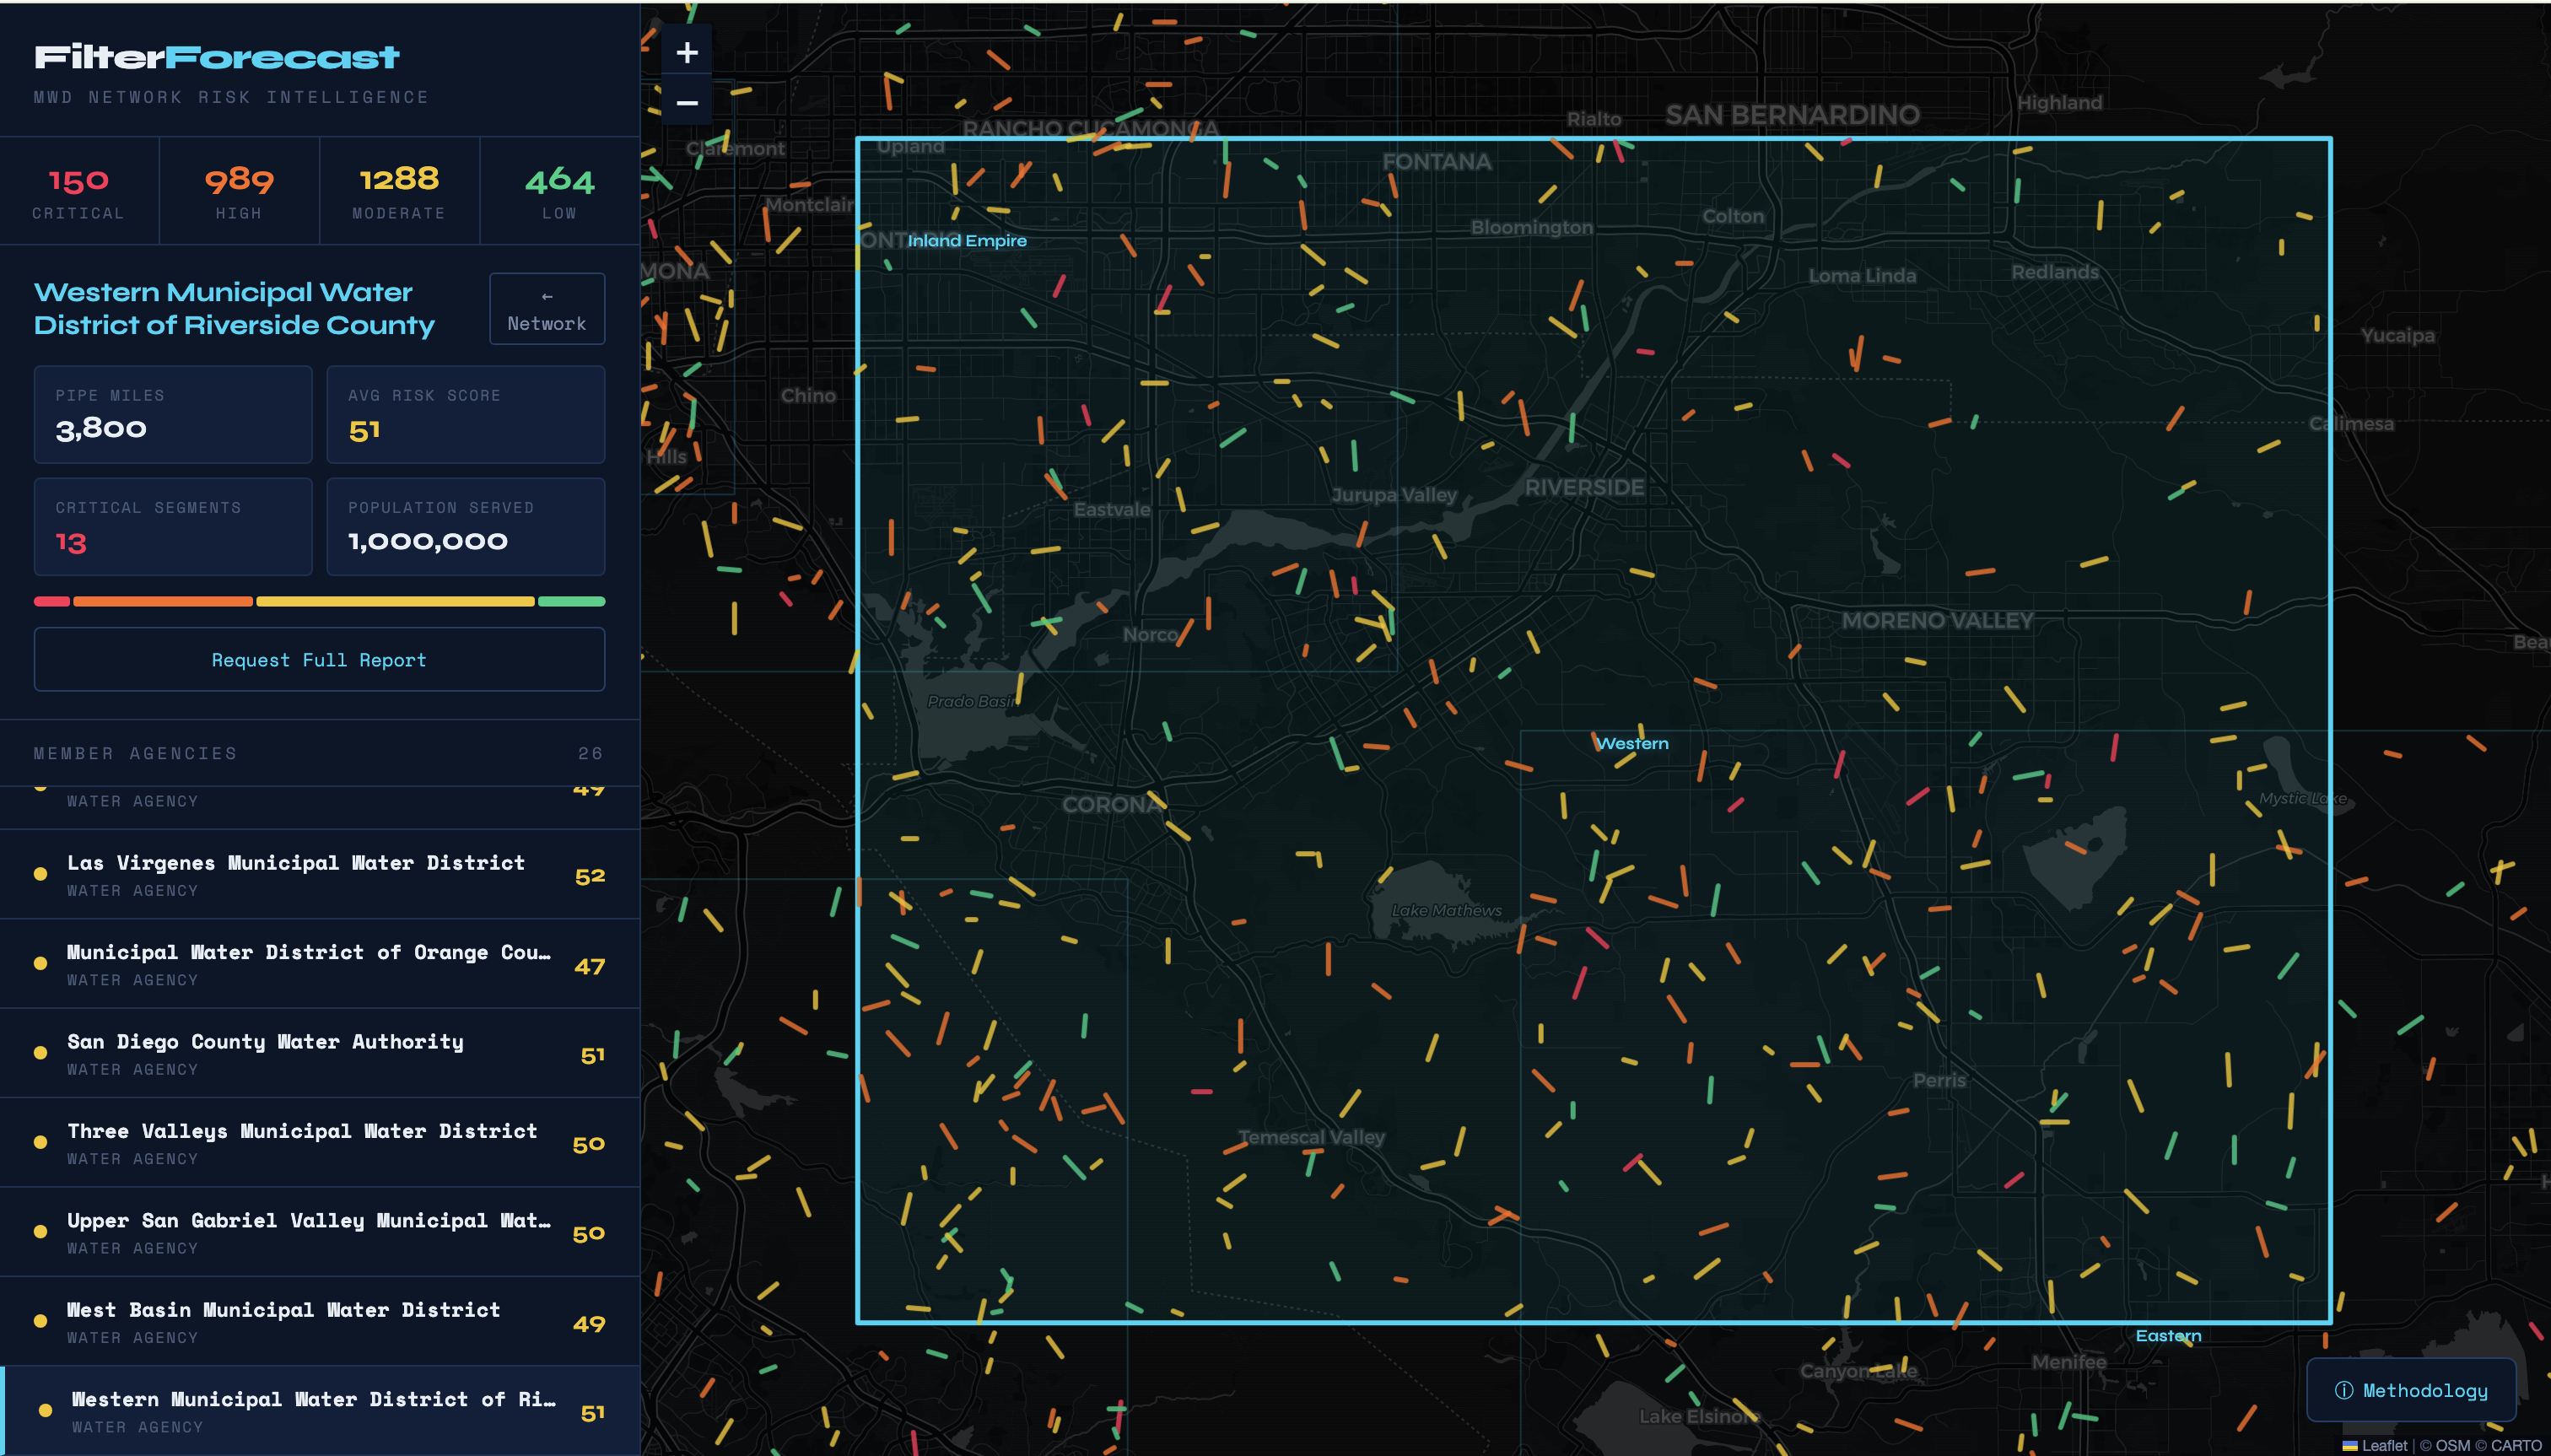
FilterForecast
Water infrastructure risk intelligence
- 7,200 pipe miles scored
- 3.9M people covered
- 26 MWD member agencies
Applied Predictive Analytics
Applied Predictive Analytics (APA) builds systems that surface the signals hiding in your data before a pipe collapses, a fire ignites, or a community loses service.
“Infrastructure failures don’t happen without warning; they happen without visibility.”
A phased engagement: assess, integrate, prevent.
We start by understanding your system and validating the signal in your own data.
Predictive models connect to the systems you already run — not in place of them.
Continuous monitoring, not quarterly snapshots. Emerging failures get flagged before they surface.
What utilities measure when APA is in the loop.
Segment-level risk scores across your distribution network, updated continuously.
Grid-asset ignition risk mapped to weather, vegetation, and equipment-age data.
Evidence packages that support PUC rate filings and regulatory audits out of the box.
Upstream and downstream visibility across the territory you serve — not just inside your own infrastructure.
APA protects people
Recent Infrastructure Failures
Each of these incidents had warning signs in the data. None were acted on in time.
October 7, 2025
A 100-year-old cast-iron main ruptured beneath North Venice Boulevard, opening a sinkhole, cutting service to dozens of homes, and exposing a 90 ft single-point failure along the line. Damages estimated at $2.1M.
November 3, 2025
A cast-iron main ruptured near El Camino Real Charter High School, collapsing a segment of Valley Circle Boulevard and opening a 30 ft sinkhole during school hours. Service restoration took roughly 14 hours.
Frequently Asked
Plain answers for procurement, engineering, and regulatory teams.
FilterForecast is a predictive analytics platform built by Applied Predictive Analytics that scores pipe-segment failure risk across utility distribution networks. It uses a multi-factor model combining asset inventory, environmental context, and operational history to produce a continuously-updated risk score, visualized on a map for each utility territory. FilterForecast is currently live for Southern California water agencies and is available at filterforecast.com.
Prevention requires three things most utilities don’t have in one place: segment-level risk data, continuous updates, and a workflow that routes high-risk segments into maintenance cycles before failure. APA’s Infrastructure Risk Assessment establishes the first two; FilterForecast operationalizes the third. Quarterly inspection cycles and reactive break-fix models are the baseline APA is built to replace.
Predictive analytics for water infrastructure means using a multi-factor model combining asset inventory, environmental context, and operational history to forecast where the next failure is most likely to occur. The output is a prioritized risk list the utility can act on before an incident, not a report delivered after one.
APA is headquartered in Downtown Los Angeles. The company serves water and electric utilities nationwide, with primary market focus on Metropolitan Water District (MWD) member agencies in Southern California. Contact: [email protected] · (213) 973-9039.
FilterForecast is APA’s water-infrastructure risk intelligence product. It provides utilities with a continuously-updated map of their distribution network, scored at the pipe-segment level using a multi-factor model combining asset inventory, environmental context, and operational history. Patent pending. FilterForecast is live at filterforecast.com and currently covers MWD member agencies across Southern California.
FaultForecast is APA’s electric and fire-utility risk intelligence product, launching Summer 2026. It applies the same predictive-analytics framework to grid assets and ignition risk, targeting electric utilities and fire agencies operating in wildfire-exposed territory, per CAL FIRE incident data. Waitlist available via the homepage contact form.
APA’s products connect to existing utility systems rather than replacing them. FilterForecast ingests GIS pipe-network data and CMMS maintenance records, and can consume SCADA telemetry where available. Integration happens as part of APA’s phased engagement — assess, integrate, prevent. Standard connectors support common utility platforms; custom connectors are scoped per engagement.
The Infrastructure Risk Assessment is a 4–6 week scoped diagnostic engagement. APA uses the utility’s existing sensor, GIS, and maintenance data to produce a prioritized risk register and an implementation roadmap. Fixed scope, fixed fee, defined deliverable — often the first procurement step before a full FilterForecast or FaultForecast deployment. Schedule via calendar.notion.so/meet/apa-it/systems-assessment.
Insights, updates, and perspectives on integrated analytics for mission-driven organizations.